You get hit with a major health condition and your health care needs and spending spikes. A lot. Welcome to the 10% club, whose members spend at least $30,000 on health care in a year. Yeah, most of it is covered by insurance, but selecting the plan with the $2,500 deductible you blew through (not to mention the thousands more in copayments) looks like a bad idea in hindsight.
It could be worse. It could happen to you next year, and the year after, and the year after that, and so on. Will it?
This is a question of health spending persistence. And, as surprising as it may sound, we don't know a lot about it, at least for the working age population. The basic problem is that researchers rarely have access to many years of health care spending data for the same set of individuals. Those data are proprietary. Some are available, but expensive to purchase.
So, most of what we know about health care spending persistence is from Medicare—clearly not representative of the working age population.
A study by Alan Garber and colleagues examined Medicare beneficiaries in the top 5% of the spending distribution in a single year. They found that 15% remained in this high cost group one year later, and 9% did so two years later. Their analysis is now quite dated, extending only through 1995. A somewhat more recent analysis by Gerald Riley found greater persistence; among top 5% spending Medicare beneficiaries in 2001, 24% were in that group one year later, 16% two years later, and 12% three years later.
Most work focused on the working age population is only able to track people for two years. For example, an analysis using the Medical Expenditure Panel Survey by Steven Cohen found that 34% of high-cost individuals in 2009 were so in 2010. But another study, by Pauly and Zeng, examined a longer time period. From a sample of insured workers and adult dependents, it found that almost half of those in the top quintile of health care spending in 1994 were in the top quintile four years later. Again, these findings are now quite dated.
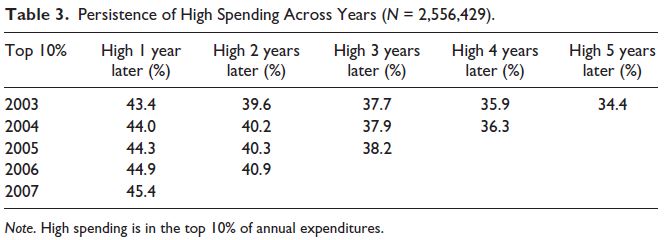
Richard Hirth and colleagues recently were able to take an analysis of persistence for workers and their dependents a lot further, and using recent data. They looked at six years of health spending data (2003-2008) for a sample of millions of individuals with coverage from over 100 medium and large employers. One of their findings is that at least one in every three high spenders in a given year will be a high spender in any of the next five years. (Here, high spender is defined as in the top 10% of the annual spending distribution.) I don't know what your prior is, but this is a much higher level of persistence than I expected. Their chart below has the details.
What does this mean in dollar terms? The following chart from the paper gives you a sense. In it "high" spending is that in the top 10% and "low" spending is that in the bottom 70% of per-person annual expenditures. With that, "usually low" means low spending in at least four of six years and no years with high spending; "low/moderate" means low spending in three or fewer years out of six and no years with high spending; "sometimes high" means one or two years out of six with high spending; "often high" means three or four years out of six of high spending; and "usually high" means five or six years of high spending.
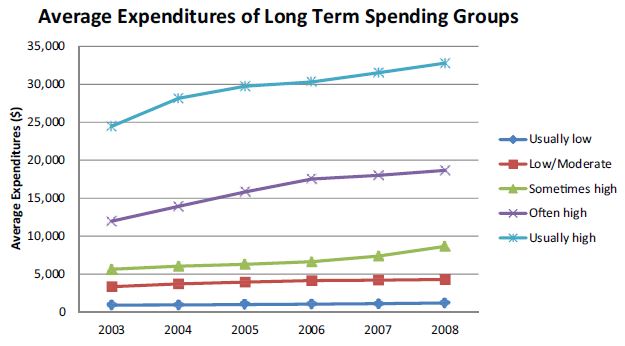
Eyeballing the chart, those in the "usually high" group had average annual expenses around $30,000. That's well above typical deductible levels for employer-sponsored plans (usually below $2,000) or Affordable Care Act plans (whose silver rated plans usually have deductibles in the $1500-$4000 range, for example). Even people in the "often high" and the "sometimes high" and probably many of those in the "low/moderate" groups would max out their deductibles too.
So, if you're unlucky enough to get hit with a very costly health condition, consider yourself relatively lucky if it's not highly persistent. The new work by Hirth and colleagues shows that such persistence is surprisingly common and remarkably long. This is how sickness saps savings, for those with coverage that comes with high enough deductibles and copayments. Today, we call that "insurance." Is it?
Austin B. Frakt, PhD, is a health economist with the Department of Veterans Affairs and an associate professor at Boston University’s School of Medicine and School of Public Health. He blogs about health economics and policy at The Incidental Economist and tweets at @afrakt. The views expressed in this post are that of the author and do not necessarily reflect the position of the Department of Veterans Affairs or Boston University.