Before I knew too much for my own good, I used to think that there ought to be a very simple solution to understanding health spending growth. Surely, I thought, one could decompose it into its constituent parts, analyze those parts, and "figure it all out."
Sounds naive, right? It is! But why?
There is no shortage of reasons. Here's one: There isn't a unique basis of decomposition. Rather, there are lots of equally valid ways to express health spending growth as a combination of other factors. If you'll excuse the math analogy, it's a lot like locating a point in space with respect to a coordinate system. You could do so in Cartesian coordinates (good old, familiar x, y in two dimensions) or polar coordinates (r, theta). They're both useful, providing a different way of characterizing the same thing and lending themselves to addressing different problems. Neither is "correct."
Similarly, one can decompose health spending growth into different sets of factors. One set, studied by many researchers, is changes in demographics, insurance, income, prices, administrative costs, and technology (the residual). I provided a summary of work that decomposes health spending growth in this way in a post in 2012. The chart below provides a some of the results at a glance.

The consensus finding is that technology growth is a (if not the) leading driver of health spending growth, though other factors play large rolls too.
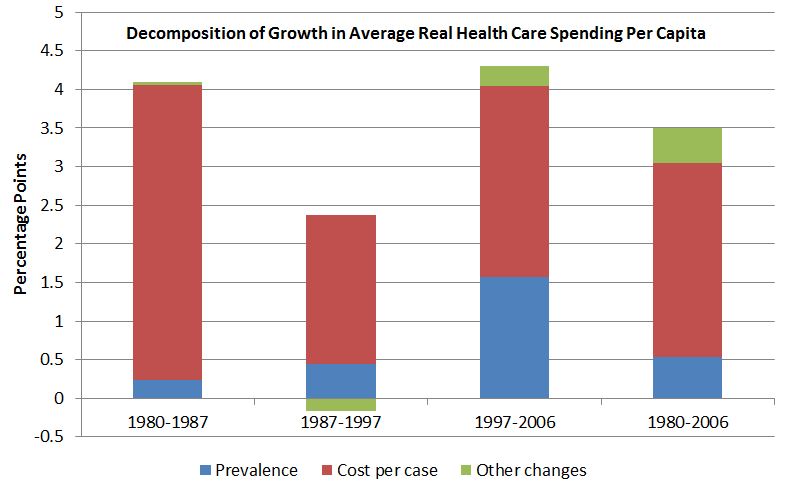
Another way to decompose health spending growth is explored in a recent study in Health Affairs by Martha Starr, Laura Dominiak, and Ana Aizcorbe. The authors examine the effects on health spending growth of disease prevalence, cost of care per case, and other factors that play smaller roles. They expand the findings of earlier work by Charles Roehrig and David Rousseau who showed that health spending growth between 1996 and 2006 was driven predominantly by the cost of care, not increasing disease prevalence, as shown in the following chart.

Martha Starr, Laura Dominiak, and Ana Aizcorbe extend the analysis back to 1980, with similar findings, as shown below. (In the chart, "other changes" include small ones due to changes in population composition and changes due to interactions between the various factors in the decomposition.) In this decomposition, cost per case is the leading and consistent driver of health spending growth.
Conceptually, we may be able to reconcile the result that much of health spending growth is due in large part to technology, in one decomposition, and spending (or "cost") per case, in another. Though other factors no doubt drive spending per case (including income growth, third-party payment, and so forth), it's a fair bet that technology plays a large roll, with the typical case for many diseases treated more intensively and with more use of ever-newer technology that costs more.
Indeed, Starr and colleagues suggest that medical innovation, coupled with insurance coverage, is a potential driver, and that more analysis is needed to more fully explain the linkages.
[T]he vast majority of growth in annual costs of treatment per disease during the period studied can be attributed to people under age sixty-five who were covered by private insurance and people ages sixty-five and older (who are almost all covered by Medicare). This is generally consistent with the idea that insurance coverage has been centrally involved in increases in costs per case, perhaps by raising returns to medical innovation, lowering its risks, or both. [...]Careful analyses of what explains variations in the pace of cost growth across more narrowly defined disease categories, including information about the timing and spread of innovations in diagnostic and therapeutic technologies, could be valuable for improving our understanding of what accounts for the longer-term pattern of robust growth in average cost per case.
Coordinate system image credit: Aerodynamics for Students.
Austin B. Frakt, PhD, is a health economist with the Department of Veterans Affairs and an associate professor at Boston University’s School of Medicine and School of Public Health. He blogs about health economics and policy at The Incidental Economist and tweets at @afrakt. The views expressed in this post are that of the author and do not necessarily reflect the position of the Department of Veterans Affairs or Boston University.