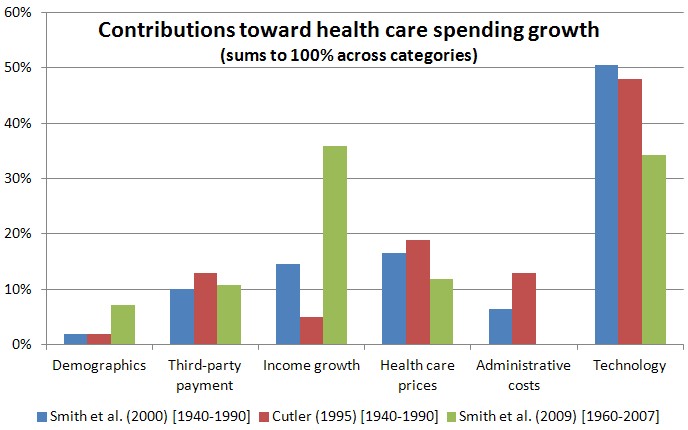
Many factors contribute to high U.S. health care spending growth. However, across many studies, one factor is consistently a leading cause: technology. For three studies, the chart below decomposes relative contributions toward spending growth of demographics, third-party payment, income growth, health care prices, administrative costs, and technology.
 Knowing that technology is a major driver of spending growth is useful but not satisfying. One wants to know how. In a recent paper in the Journal of Economics Literature, Amitabh Chandra and Jonathan Skinner tell us. They divide health care technologies into three categories.
Category I: “Home Run” Technologies. These are health care technologies that are cost-effective for nearly everyone who would want them or could benefit from them. They include: hand washing; surgical/exam gloves; cleansing wounds; antibiotics; surfactants to treat neonatal acute respiratory distress for newborns; antiretroviral drugs for HIV patients; and testicular cancer treatment. These technologies, and others like them, play a circumscribed role in spending growth because, by and large, the only people who want them or are offered them are those who benefit tremendously from them. There is little risk of inappropriate expansion of use to those who would derive little benefit. The authors convey this in a chart.
Knowing that technology is a major driver of spending growth is useful but not satisfying. One wants to know how. In a recent paper in the Journal of Economics Literature, Amitabh Chandra and Jonathan Skinner tell us. They divide health care technologies into three categories.
Category I: “Home Run” Technologies. These are health care technologies that are cost-effective for nearly everyone who would want them or could benefit from them. They include: hand washing; surgical/exam gloves; cleansing wounds; antibiotics; surfactants to treat neonatal acute respiratory distress for newborns; antiretroviral drugs for HIV patients; and testicular cancer treatment. These technologies, and others like them, play a circumscribed role in spending growth because, by and large, the only people who want them or are offered them are those who benefit tremendously from them. There is little risk of inappropriate expansion of use to those who would derive little benefit. The authors convey this in a chart.
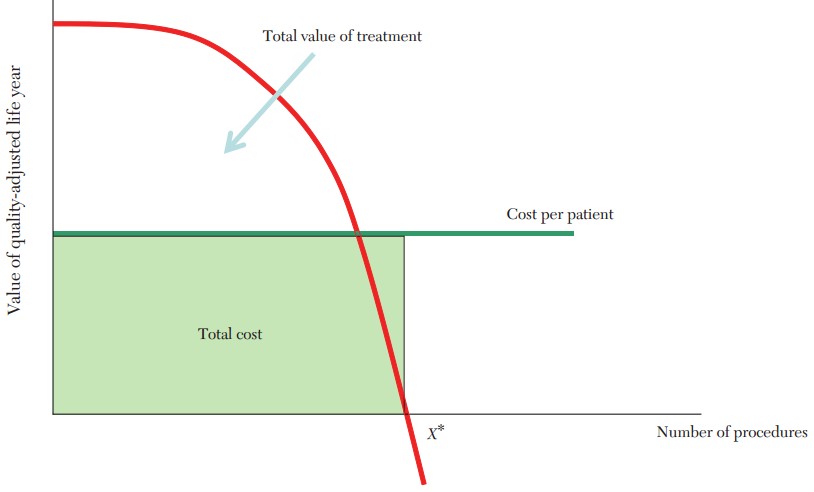 The key is that the value of treatments falls rapidly with the number of procedures (red line). Consequently, there are few procedures done for low value (i.e., below cost).
Category II: Potentially Cost-Effective Technologies with Heterogeneous Benefits. These are treatments that are cost-effective for some patients and low benefit for others who still may seek or receive them. These include: angioplasty; antidepressants; cesarean sections; imaging technologies; and prostate cancer screening and treatment. The chart looks very different (read "Cost per PCI" as "cost per patient"):
The key is that the value of treatments falls rapidly with the number of procedures (red line). Consequently, there are few procedures done for low value (i.e., below cost).
Category II: Potentially Cost-Effective Technologies with Heterogeneous Benefits. These are treatments that are cost-effective for some patients and low benefit for others who still may seek or receive them. These include: angioplasty; antidepressants; cesarean sections; imaging technologies; and prostate cancer screening and treatment. The chart looks very different (read "Cost per PCI" as "cost per patient"):
 Unlike Category I treatments, those of Category II are often applied to patients for whom they provide little to no benefit. Notice how the red line does not dive quickly toward the horizontal axis, as it did for Category I treatments. Instead, it gently falls, providing low, yet positive, value (below cost) over a large number of procedures. This is why, in the presence of third-party payment, these technologies can become overused relative to their cost. That is, they help drive cost up for small (or no) gain in benefit.
Category III: Technologies with Modest or Uncertain Effectiveness. These are treatments for which cost-effectiveness is not known to be low (or value relative to cost high) for anyone. They include: arthroscopic surgery for osteoarthritis of the knee; frequent office visits; ICU days for the chronically ill; and referrals to specialists. To be sure, some of these could be of high value to some subset of patients, but that subset has not yet been unambiguously identified. The authors provide no chart for Category III. They share one thing in common with Category II technologies, which is that rapid and widespread diffusion is not justified by the evidence available to date.
So, how does technology drive up health care spending? It does so largely in two ways. The first way is by being broadly effective. This leads to increased health spending that one can argue is worth the cost, like Category I technologies. The second way is by being over-applied. This leads to increase health spending that one can argue is not or not always worth the cost, like some use of Category II and, as far as we know, all of Category III technologies.
Of course this is not a full account of how technology drives up costs. But it is a helpful typology that suggests follow-up questions. I bet you can think of some.
References
Cutler (1995). Technology, Health Costs, and the NIH. Paper prepared for the National Institutes of Health Economics Roundtable on Biomedical Research, September.
Smith et al. (2000). The Impact of Technological Change on Health Care Cost Increases: An Evaluation of the Literature. Working paper.
Smith et al. (2009). Income, Insurance, and Technology: Why Does Health Spending Outpace Economic Growth? Health Affairs September/October 2009 28(5):1276-1284.
*this post was updated on 10/19/12 to correct a small typo.
Unlike Category I treatments, those of Category II are often applied to patients for whom they provide little to no benefit. Notice how the red line does not dive quickly toward the horizontal axis, as it did for Category I treatments. Instead, it gently falls, providing low, yet positive, value (below cost) over a large number of procedures. This is why, in the presence of third-party payment, these technologies can become overused relative to their cost. That is, they help drive cost up for small (or no) gain in benefit.
Category III: Technologies with Modest or Uncertain Effectiveness. These are treatments for which cost-effectiveness is not known to be low (or value relative to cost high) for anyone. They include: arthroscopic surgery for osteoarthritis of the knee; frequent office visits; ICU days for the chronically ill; and referrals to specialists. To be sure, some of these could be of high value to some subset of patients, but that subset has not yet been unambiguously identified. The authors provide no chart for Category III. They share one thing in common with Category II technologies, which is that rapid and widespread diffusion is not justified by the evidence available to date.
So, how does technology drive up health care spending? It does so largely in two ways. The first way is by being broadly effective. This leads to increased health spending that one can argue is worth the cost, like Category I technologies. The second way is by being over-applied. This leads to increase health spending that one can argue is not or not always worth the cost, like some use of Category II and, as far as we know, all of Category III technologies.
Of course this is not a full account of how technology drives up costs. But it is a helpful typology that suggests follow-up questions. I bet you can think of some.
References
Cutler (1995). Technology, Health Costs, and the NIH. Paper prepared for the National Institutes of Health Economics Roundtable on Biomedical Research, September.
Smith et al. (2000). The Impact of Technological Change on Health Care Cost Increases: An Evaluation of the Literature. Working paper.
Smith et al. (2009). Income, Insurance, and Technology: Why Does Health Spending Outpace Economic Growth? Health Affairs September/October 2009 28(5):1276-1284.
*this post was updated on 10/19/12 to correct a small typo.